Infographic
Forrester Research — Azure SAP TEI
Client
Forrester Research (commissioned by Microsoft)
Year
2021
Software
Adobe Illustrator
The Challenge
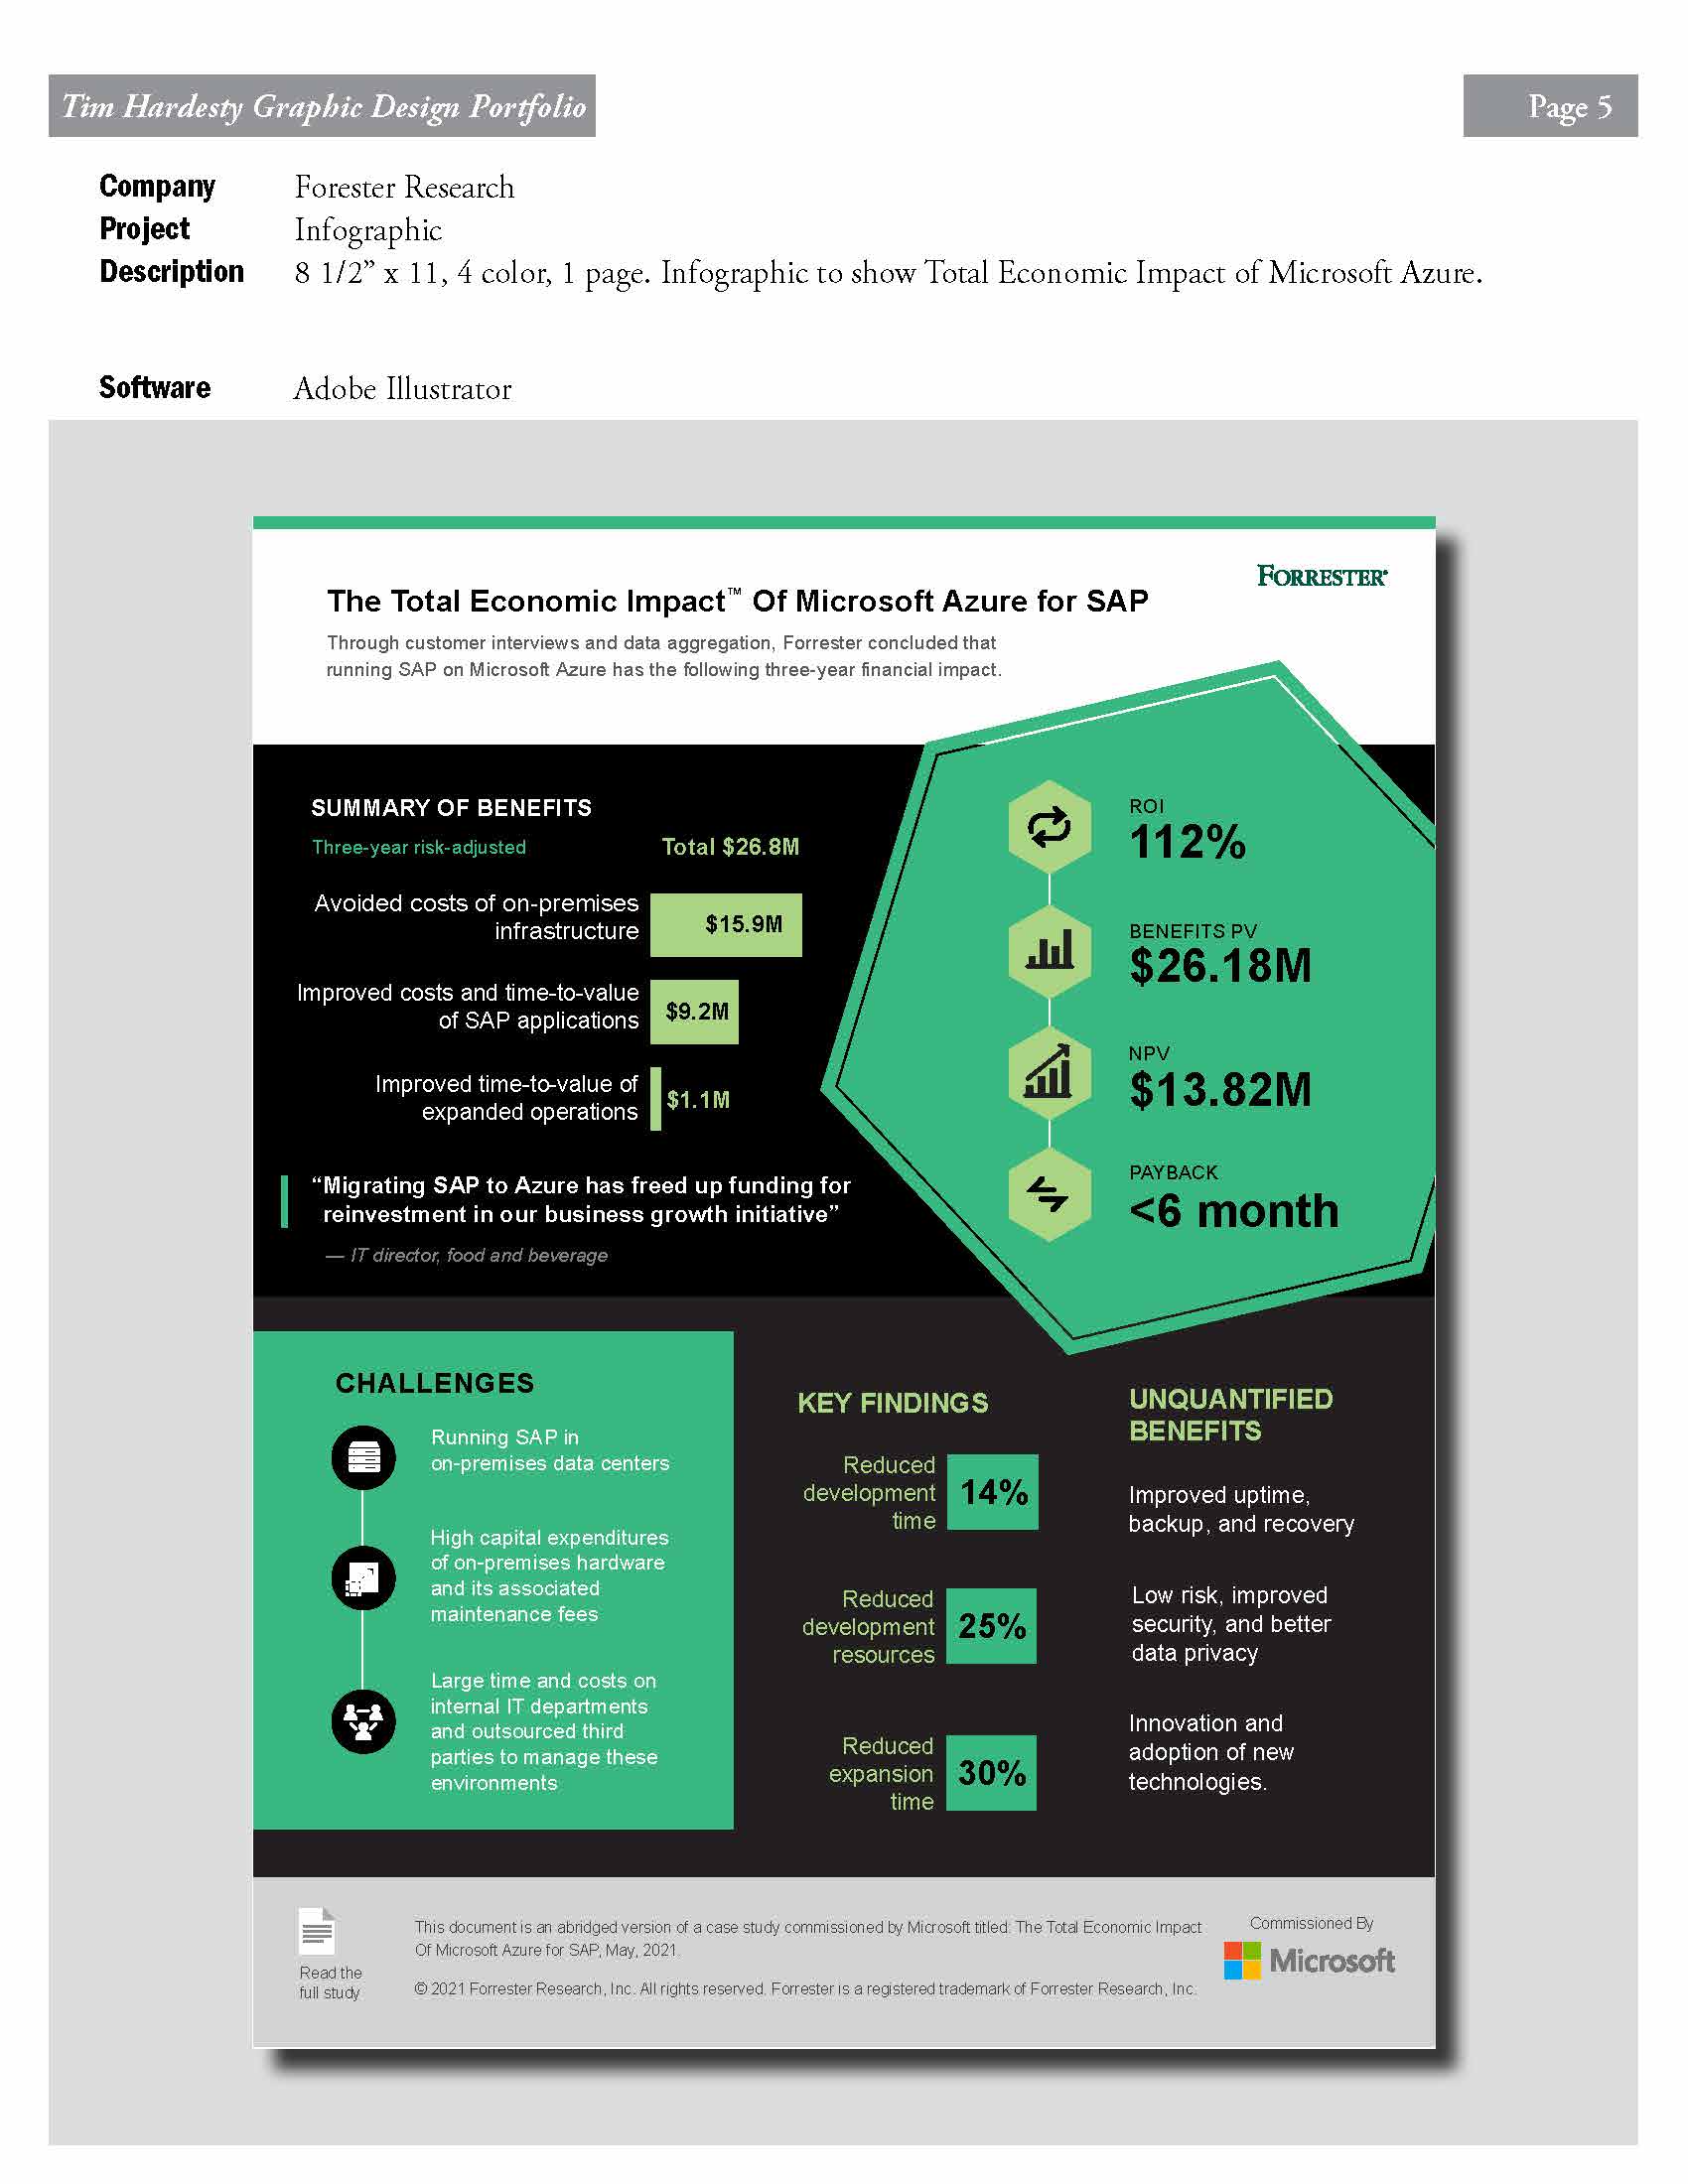
Communicate a Forrester Total Economic Impact study — covering three years of ROI data from running SAP workloads on Microsoft Azure — in a single 8.5×11" page. The study included headline metrics, a structured breakdown of cost categories, key findings across multiple dimensions, and a section on unquantified benefits. All of it needed to fit, be readable, and carry the Forrester brand.
The Solution
A high-contrast four-color infographic built to Forrester brand standards. The top third anchors on the three headline numbers — 112% ROI, $26.18M in total benefits, payback in under six months — large enough to read across a conference table. Below that: a structured breakdown of the benefit categories with their individual dollar values, a key findings section, and a callout for unquantified benefits. Dense information made navigable through hierarchy, color, and spatial logic rather than prose.